Data analytics
Data interpretation and analysis with the cosinuss° Health Platform
Valid and reliable data is the essential basis for any further analysis and thus the essential first step in creating health insights. cosinuss° provides suitable support for evaluating data quality and additional information on how to interpret data collected with the cosinuss° in-ear sensor and the cosinuss° Gateway.
First interpretation of the measured data
Examples of accurate measurements
Valid PPG Signal
The photoplethysmogram signal (PPG) displays the blood volume changes through light absorption of the arterial blood. Each cardiac cycle is shown as a peak in the raw data graph. Valid PPG signals are necessary to derive the SpO2 and respiration rate.
A good PPG signal has
- no or only a few motion artifacts,
- regular heart beats,
- no jumps of the constant component of the PPG,
- a high signal to noise ratio.

Acceleration Data
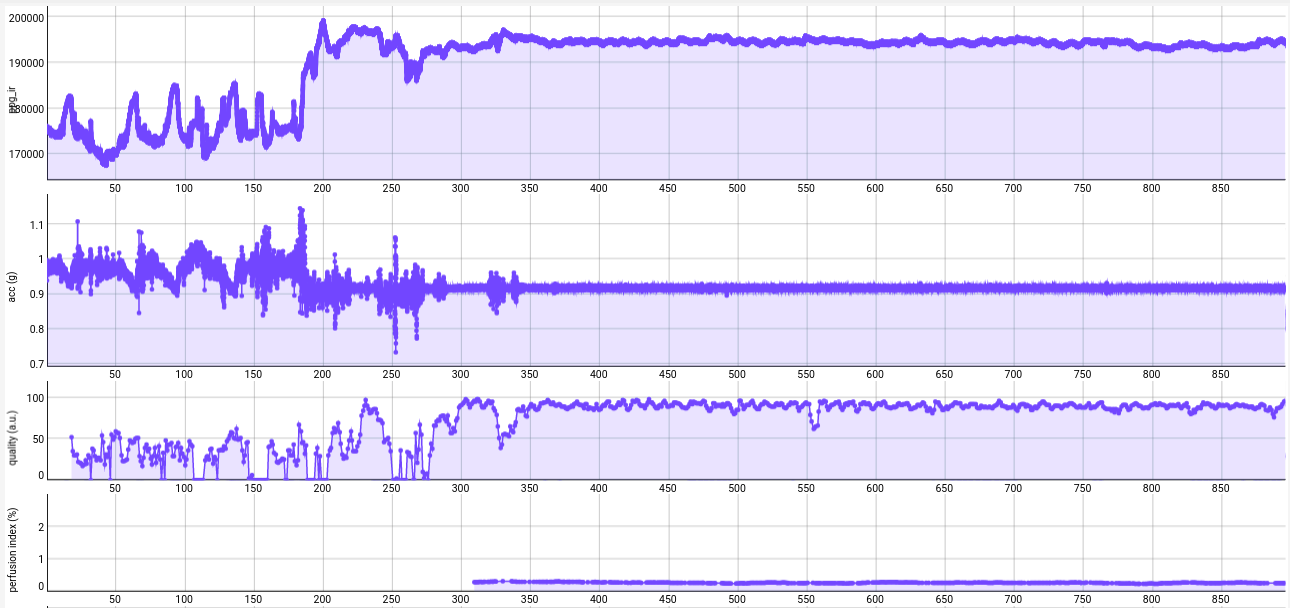
The acceleration data shows the movement of the subject. For valid data collection, especially regarding the SpO2 value and the respiration rate, movements are obstructive. In the example, the range of movement is only between 0,9 – 0,93 so the subject was almost not moving.

Quality Index
The quality index shows the quality of the PPG signal relating to the calculation of heart rate values. It should always be above 40 to ensure valuable calculated data. If this is not the case, it needs to be checked if the sensor has slipped out a bit of the subject’s ear or if the sensor size is not correctly chosen.

Perfusion Index
The perfusion index is the quality of the PPG signal relating to the calculation of SpO2 values. It should always be in the range of 0,2 – 2. If this is not the case, another sensor size in the ear canal should be tried.

Accurate vital signs
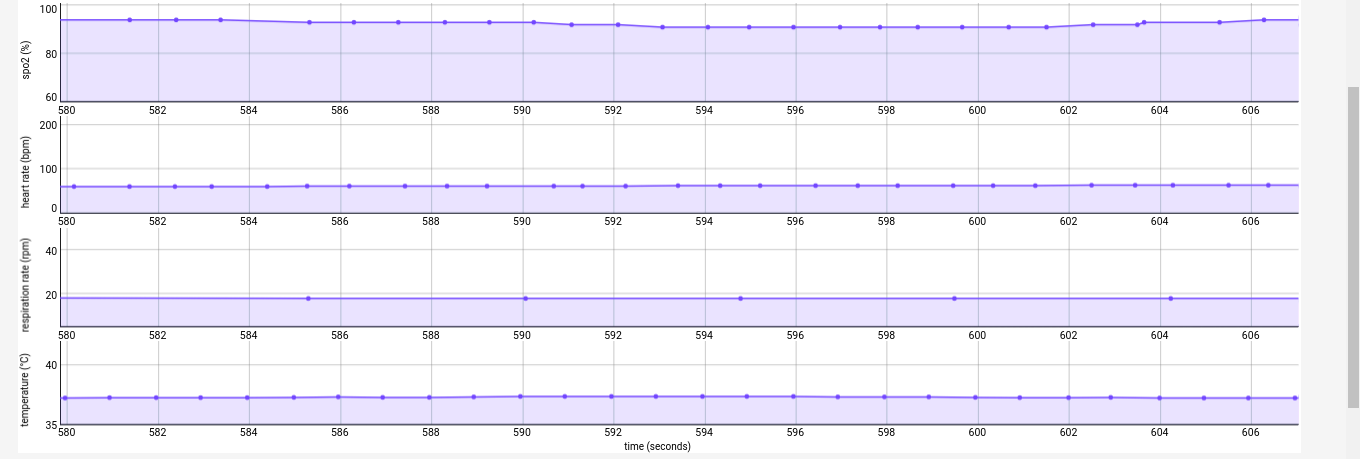
When the raw data is valid, as seen in the examples above, the algorithms can calculate the vital parameters. Accurate data of SpO2, respiration rate, heart rate and body core temperature are calculated and shown on the cosinuss° Health Platform.

Examples of inaccurate measurements
Bluetooth Connection Loss
If the actively measuring in-ear sensor leaves the range of 10 meters to the cosinuss° Gateway or runs out of battery, a connection loss on the graph on the cosinuss° Health Platform is visible. This is shown with straight lines through the raw data graphs as shown in the picture below.

Wrong sensor fitting
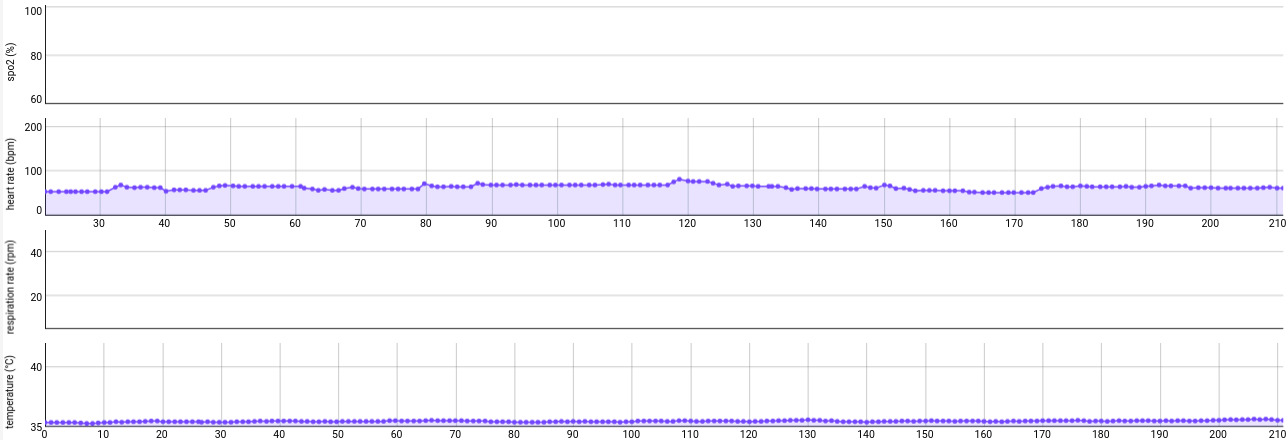
When the core body temperature of a subject falls under 35 °C either the sensor is slipping out of the ear or the subject has the wrong sensor size. In this case, the sensor can’t detect valid raw data anymore and vital parameters potentially cannot be calculated anymore. The impact can be seen immediately on the missing SpO2 and respiration rate values.

Very low temperature
When the core body temperature is lowering a lot, it indicates that the sensor might have slipped out of the subject’s ear or is even not inside of it.

Movements
Lots of movements disturb the measurements. It can be seen when the acceleration data is moving in a wide range (here from 0,7 – 1,1). As a result, the sensor might not be able to extract movement related signal changes from correct data and calculation of SpO2 and respiration rate might not be possible.

Combined analysis of vital signs
Using the combined information of several relevant vital sign data streams, highly relevant health insights can be derived with the help of algorithms. For example, such insights can be the evaluation of heart health or the detection of stress, heat stroke and epileptical seizures.
ON REQUEST
cosinuss° can provide specific algorithms to derive health insights or support you in the process of implementing the same. Get in touch in order to receive more information and support.